Why does 2f/1f signal processing make TDLAS stable? Direct absorption spectroscopy measures the absolute drop in light intensity, making it vulnerable to any non-absorption loss (like dust on a window or laser aging). Wavelength Modulation Spectroscopy (WMS) with 2f/1f normalisation solves this. By dividing the second harmonic (2f, which contains the gas absorption shape) by the first harmonic (1f, which tracks the background laser intensity), the resulting ratio is completely independent of the absolute light level. This mathematical normalisation allows the TDLAS module to maintain calibration even if 90% of the light is blocked by coal dust.
1. The drift problem in direct absorption
The simplest way to use a laser for gas measurement is Direct Absorption Spectroscopy (DAS). You shine the laser through the gas, measure the light intensity at the detector, and calculate the concentration based on how much light is missing.
The problem with DAS in industrial environments is that gas absorption is not the only thing that causes light loss. Over time, optical windows accumulate dust or condensation. The laser diode itself slowly ages, emitting slightly less power. If a speck of coal dust blocks 10% of the laser beam, a DAS system will misinterpret that 10% drop in light as a massive spike in gas concentration. This causes zero drift and requires frequent recalibration.
2. Enter Wavelength Modulation Spectroscopy (WMS)
To solve the drift problem, high-end TDLAS modules use a technique called Wavelength Modulation Spectroscopy (WMS).
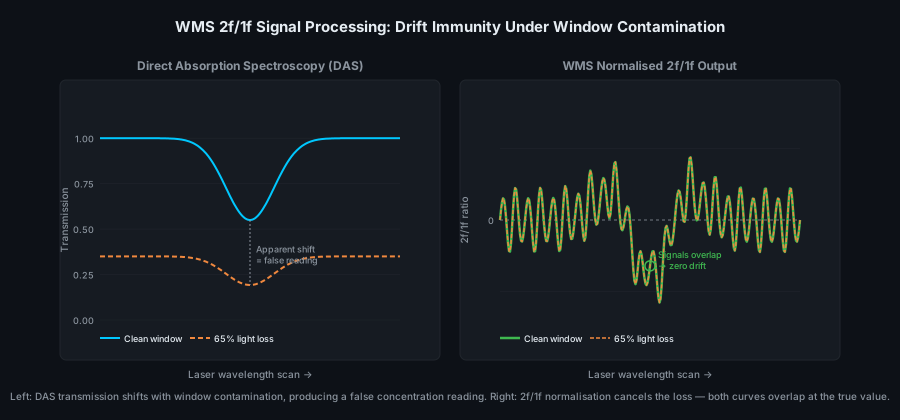
Instead of just scanning the laser wavelength linearly across the gas absorption line, WMS adds a high-frequency sinusoidal modulation to the laser injection current. As the laser sweeps across the absorption peak, this high-frequency "wiggle" produces harmonic signals at the detector.
Using digital lock-in amplifiers within the module's DSP, we can extract specific harmonics. The most important is the second harmonic (2f). The shape and amplitude of the 2f signal are directly proportional to the gas concentration. Crucially, the 2f signal sits on a zero baseline—if there is no gas, there is no 2f signal, regardless of the background light level.
3. The magic of the ratio: 2f/1f normalisation
While the 2f signal isolates the gas absorption, its amplitude still depends on the total amount of light reaching the detector. If the window gets dirty, the 2f signal will shrink, leading to a falsely low reading (span drift).
This is where the first harmonic (1f) comes in. The 1f signal is essentially a measure of the background laser intensity arriving at the detector, independent of the gas absorption.
By continuously dividing the 2f signal by the 1f signal in real-time, the module performs mathematical normalisation. Because both 2f and 1f are affected equally by non-absorption losses (like dust or laser aging), dividing them cancels out the loss entirely.
(2f × Light Loss) / (1f × Light Loss) = 2f / 1f = True Gas Concentration
4. Real-world impact in harsh environments
This 2f/1f normalisation is what transforms TDLAS from a laboratory curiosity into an industrial workhorse.
In a coal mine gas drainage pipeline, it is guaranteed that the optical windows of a Line B insertion module will eventually become coated with a film of water and fine coal dust. Without 2f/1f processing, the sensor would fail within days.
With 2f/1f processing, the module can continue to report highly accurate methane concentrations even if the optical transmission drops by 80% or 90%. The module's internal diagnostics simply monitor the 1f signal; when the light level finally drops too low for the detector to function, the module outputs a "Clean Window" maintenance flag via RS485, rather than outputting a dangerous false reading.
5. Conclusion
When specifying a TDLAS module for an OEM instrument, it is not enough to ask if it uses a laser. You must verify the signal processing architecture. A module running basic DAS will drift just like an NDIR sensor. A module running WMS with robust 2f/1f normalisation will deliver the long-term stability and extended calibration intervals that industrial customers demand.
Concerned about long-term drift?
Tell us your target maintenance interval and expected environmental contamination. We will assess how the Line A or Line B DSP architecture can meet your stability requirements.